Mellum2.1 changes the model choice, not the service boundary
JetBrains’ October 8, 2026 Mellum2.1 announcement introduces a 12-billion-parameter mixture-of-experts coding model with 2.5 billion active parameters, released under Apache 2.0. It distinguishes available model weights from forthcoming GGUF builds and a speculative-decoding head. That distinction matters operationally: an architecture review can begin with the released weights, but a production capacity plan should not assume the performance or memory footprint of artifacts that are still forthcoming.
For an operator considering a private coding-agent service, the release creates another deployable model option. It does not establish how many repository tasks a particular cluster can complete. A coding agent repeatedly reads files, requests inference, executes tools, builds software and runs tests. GPU inference is one stage in that loop, not the entire service.
On an estate ranging from a quarter rack to a few racks, the first constraint may be CPU execution slots, repository storage latency or queue discipline. The useful question is therefore not simply how quickly Mellum2.1 emits tokens. It is how many accepted engineering tasks the whole system completes within a defined time and cost envelope.
Size memory from the full model
The 2.5-billion active-parameter figure describes conditional computation; it is not a VRAM sizing rule. Unless a validated serving implementation explicitly offloads or distributes experts, budget for the full set of resident weights. Then add runtime allocations, KV cache, concurrency headroom and any implementation-specific buffers.
As an order-of-magnitude calculation, 12 billion parameters stored at two bytes each require approximately 24 GB in decimal units for weights alone, or about 22.4 GiB. That is not a minimum supported GPU specification: loading overhead, architecture details, context length and serving behavior can materially change the requirement. Quantized formats alter weight storage, but bring their own metadata and compatibility constraints.
Start with a supported runtime and the actual released artifact. Measure peak device memory during loading, warm-up and concurrent requests at the intended context lengths. Record failures as well as throughput. Do not price the service around a future GGUF build or assume the speculative-decoding head is already available. When either arrives, treat it as a new configuration requiring regression and capacity testing.
Trace the entire repository-task loop
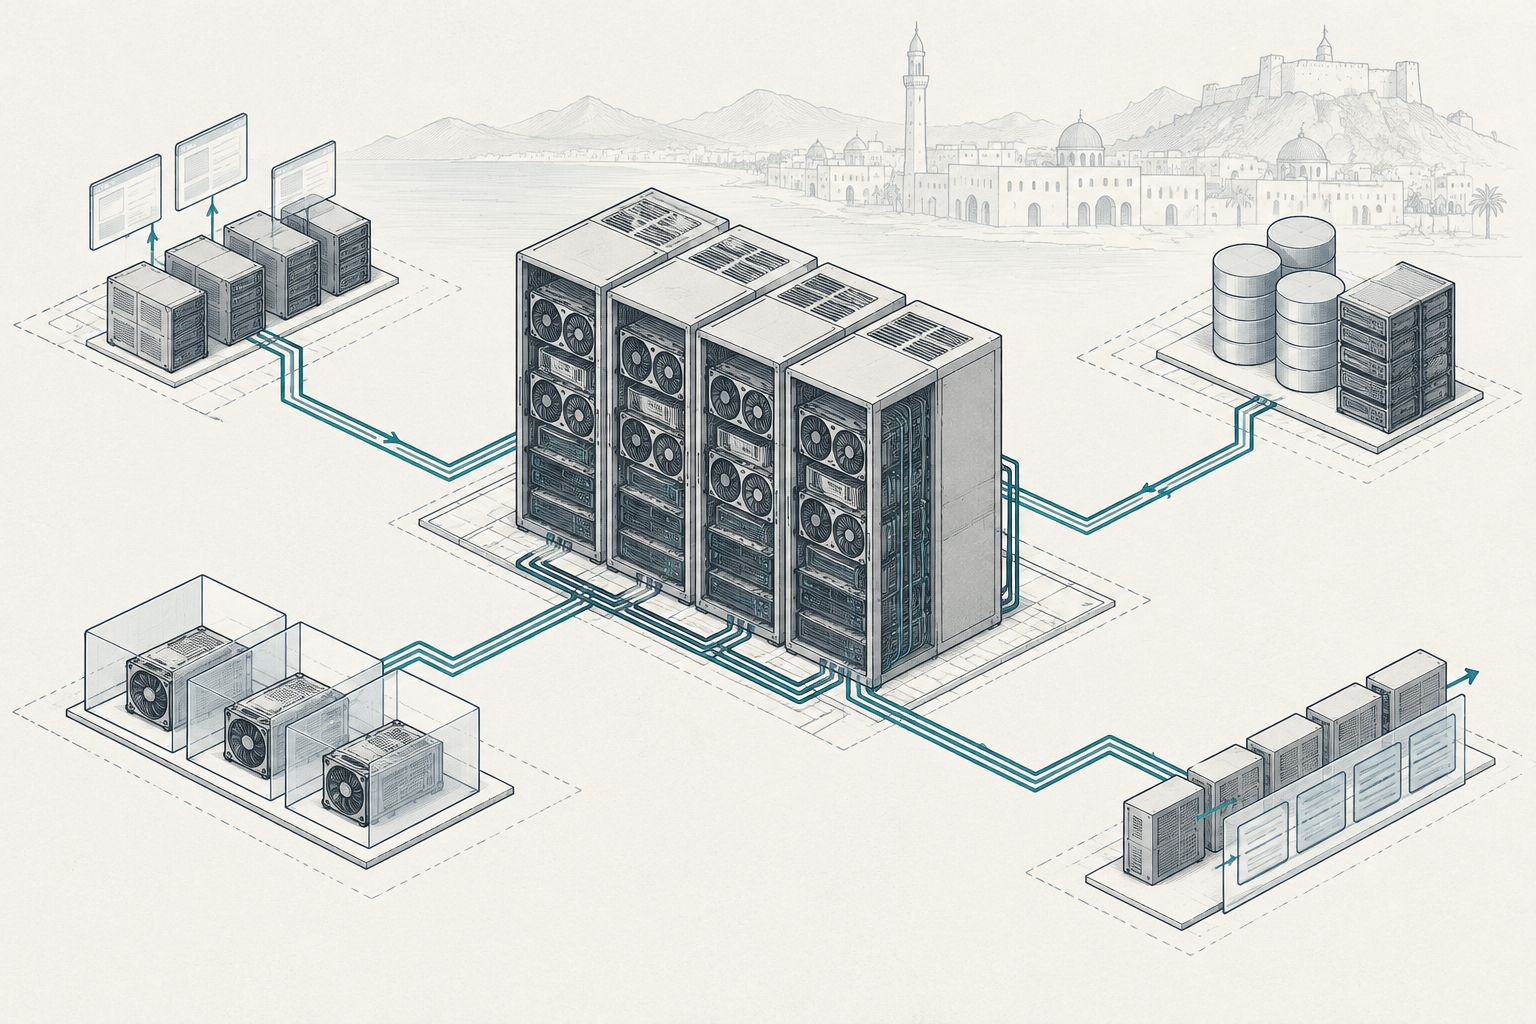
A private service needs more than a model server behind an API. It needs an authenticated entry point, a task scheduler, an agent controller, an inference pool, isolated execution workers and storage for repositories, caches and results. Each boundary should carry a tenant identity and a task identifier.
The agent controller should submit tool execution to a sandbox rather than run repository commands inside the model-serving container. Repository content and build scripts are untrusted execution inputs, even when they come from an internal project. Keep model weights, serving credentials and infrastructure administration interfaces outside that sandbox’s reach.
Separate the lifecycle of inference workers from execution workers. A slow integration test should occupy a sandbox slot, not pin a GPU reservation unnecessarily. Conversely, a full inference queue should not cause hundreds of CPU workers to sit idle while retaining large memory allocations. Apply admission control before expensive resources are acquired, with bounded queues and explicit timeout behavior.
Benchmark completed work, including failures
Build a local evaluation set from approved repositories and representative maintenance tasks: correcting a failing unit test, updating an API call, fixing a small defect or adding a constrained feature. Freeze repository revisions and execution environments so changes in results can be attributed to the service rather than moving dependencies.
Define completion before running the benchmark. A plausible patch is not necessarily an accepted task. Require the relevant tests, a bounded change scope and, where appropriate, a reviewer’s acceptance. Set limits on elapsed time, retries and tool calls. Report the acceptance rate separately from the speed of successful runs so fast failures do not improve the headline metric.
| Layer | Measure | Decision it informs |
|---|---|---|
| Inference | Queue delay, latency, peak VRAM | Batch and replica limits |
| Sandbox | CPU time, memory, execution wait | Worker pool sizing |
| Storage | Checkout latency, metadata operations | Cache and volume layout |
| Task | Acceptance rate, elapsed time, retries | Service target and cost |
Increase agent concurrency in controlled steps while holding the task mix constant. Stop when accepted throughput flattens, tail latency exceeds the service target or failure rates rise. GPU utilisation alone cannot identify that point.
Find the bottleneck before buying another GPU
Suppose inference remains responsive but agents spend increasing time waiting for test execution. More GPU capacity will not remove that queue. Inspect sandbox CPU saturation, memory pressure and the number of simultaneously runnable builds. Compilation and test processes can create substantial bursts that disappear inside hourly averages.
Repository operations deserve the same attention. Many small files, dependency extraction and repeated checkouts can stress metadata paths before exhausting storage bandwidth. Measure those operations under concurrent load rather than relying on sequential transfer benchmarks. Distinguish cold-cache performance from repeated runs against the same repository.
A useful load test varies one pool at a time: hold inference capacity fixed and add execution workers, then hold execution capacity fixed and vary inference concurrency. Repeat with cold repositories. This reveals whether additional capacity produces accepted tasks or merely moves waiting time to another queue. Keep a per-stage timing trace so operators can explain a slow task without reconstructing events from unrelated logs.
Use tenancy to protect interactive engineering work
Different teams will submit different workloads. One may need short interactive edits; another may launch a batch of dependency migrations across dozens of repositories. A single first-in, first-out queue allows the batch workload to turn an otherwise healthy service into an unresponsive one.
Use per-team concurrency ceilings, queue depth limits and weighted fairness. Reserve some capacity for interactive requests if that is part of the service commitment, but allow controlled borrowing when it would otherwise sit idle. Define cancellation and retry semantics so abandoned tasks do not continue consuming resources.
Quota engineering should cover more than GPUs: sandbox CPU and memory, execution duration, storage capacity, artifact retention and model-request budgets all matter. GPU partitioning can provide smaller allocation units where the hardware and runtime support it. It is not universally available, and a partition must still accommodate the model’s real memory demand. Benchmark partitioned operation against shared serving and dedicated replicas rather than assuming one arrangement is always cheaper.
Put the service on an explicit infrastructure substrate
Clastiq Orchestrator provides the infrastructure layer for this design: bare-metal provisioning, Kubernetes and VM tenancy, GPU partitioning, Ceph storage, per-tenant metering and chargeback, and quota and policy engineering. The coding-agent controller, evaluation harness and task-level accounting still need deployment and integration; they should not be implied by the presence of an orchestrator.
Use Kubernetes tenancy for managed serving components and execution pools where it fits the security model. Use VM boundaries when workloads require a different isolation envelope. Namespaces alone are not a sufficient security boundary for arbitrary repository execution. Align the chosen sandbox technology with the threat model and patching process.
Infrastructure policy should prevent an execution pool from consuming the memory or CPU capacity needed to keep inference healthy. Storage quotas and retention rules should prevent one team’s artifacts from exhausting shared capacity. Hardware-agnostic orchestration is useful here because available servers need not be identical: placement must respect their actual memory, accelerator and storage characteristics rather than flattening them into interchangeable slots.
Separate durable storage from disposable execution state
Ceph can provide durable storage for approved repository mirrors, task artifacts and persistent tenant data. The correct interface and layout depend on access patterns; object storage, block volumes and shared filesystems are not interchangeable performance choices. Test the intended configuration with real checkout and build workloads.
Use disposable local scratch space for suitable temporary build data, with explicit cleanup and capacity limits. Shared dependency caches can reduce downloads and repeated work, but they need tenant-aware access control and protections against cache poisoning. Do not turn a performance optimization into a route for one project to alter another project’s build inputs.
Plan recovery as well as steady-state throughput. A storage rebuild can compete with repository reads and artifact writes. Leave headroom and test degraded operation. Snapshots, replication and backups solve different problems; define which task records, repository mirrors and configuration state must survive a failure, then test restoration against those requirements.
Work a chargeback example from accepted tasks
Consider an illustrative eight-GPU estate, not a Mellum2.1 benchmark. Over a 30-day month, it has 8 × 24 × 30 = 5,760 available GPU-hours. Suppose 60% of that capacity is assigned to the coding service: 3,456 allocated GPU-hours. Allocation is not device utilisation; measure both separately.
If the internal rate is USD 2.00 per allocated GPU-hour, the accelerator charge is USD 6,912. Assume the service also consumes 12,000 sandbox vCPU-hours at USD 0.04, adding USD 480, plus USD 240 for its allocated storage and retained artifacts. The modeled monthly subtotal is USD 7,632. These are planning assumptions, not market quotations or a complete business case.
If the service accepts 24,000 tasks that month, the subtotal is USD 0.318 per accepted task. If retries and failures reduce acceptance to 16,000 tasks without reducing resource consumption, it rises to USD 0.477. That 50% increase is invisible in a tokens-per-second chart.
For a team responsible for 25% of each measured resource category, chargeback would be USD 1,908. Real teams rarely have identical usage shares, so calculate each category separately. State whether rates include electricity, facility overhead, depreciation and support; avoid charging those costs twice.
Meter shared inference without inventing precision
Dedicated tenant allocations are relatively straightforward to meter. Shared inference is harder because batching lets requests overlap in time. Wall-clock request duration is not automatically attributable GPU time, and output-token counts ignore prompt processing, context length and differences in execution behavior.
Choose a documented allocation method: reserved capacity, a measured usage proxy, or a combination of base reservation and variable consumption. Label proxy-based accounting honestly. Retain enough evidence to reconcile tenant bills with pool totals, including unallocated overhead and failed work. Meter sandbox CPU, storage and retention independently instead of hiding them inside a token price.
A minimal task record might look like this:
{
  "task_id": "repo-fix-0042",
  "tenant": "engineering-a",
  "model_revision": "pinned-artifact-digest",
  "accepted": true,
  "sandbox_vcpu_seconds": 960,
  "queue_seconds": 18,
  "elapsed_seconds": 242
}
This is an illustrative accounting record, not a Clastiq API schema. Keep source code, prompts and credentials out of general billing logs. Link restricted execution evidence through controlled identifiers rather than duplicating sensitive content everywhere.
Make GCC sovereignty operational, not geographic shorthand
For GCC engineering teams, private hosting can keep proprietary repositories and execution within an operator-controlled environment. But a server located in Oman or another GCC jurisdiction does not, by itself, establish sovereignty or compliance. Trace outbound model calls, package downloads, telemetry, identity dependencies, backup locations and remote support access.
Air-gap deployments require an import process for model artifacts, container images, operating-system updates and language packages. Record provenance and checksums, scan imported content and define how urgent fixes cross the boundary. Pin model revisions so an evaluation result maps to the artifact actually running. Review model licensing separately from repository and dependency licenses.
Power is another shared constraint. Concurrent tests can raise CPU draw while inference keeps accelerators active. Measure whole-node and rack demand during combined peaks, including cooling capacity and power limits. Admission control may be safer than allowing every worker pool to burst simultaneously. Cognition-AI is based in Muscat, Oman, and provides human-led local support; operators should still agree access procedures, escalation responsibilities and maintenance windows explicitly.
What to do this week
- Pin the release boundary. Record the Mellum2.1 weight revision, license and runtime. Exclude forthcoming GGUF builds and the speculative-decoding head from the initial capacity commitment.
- Run a repository-task baseline. Select approved tasks, define acceptance and retry limits, and measure successful throughput alongside queue delay, peak VRAM and sandbox consumption.
- Sweep concurrency across the whole service. Test inference, execution and storage independently, then together. Include cold caches and a competing batch tenant.
- Enforce isolation and fairness. Set team quotas, sandbox boundaries, execution timeouts, storage retention and interactive queue protection before opening access broadly.
- Publish the operating cost model. Separate allocated GPU-hours from utilisation, reconcile shared-pool accounting, and report cost per accepted task with explicit exclusions.
Clastiq Orchestrator runs this infrastructure on the operator’s own hardware: request a demo.