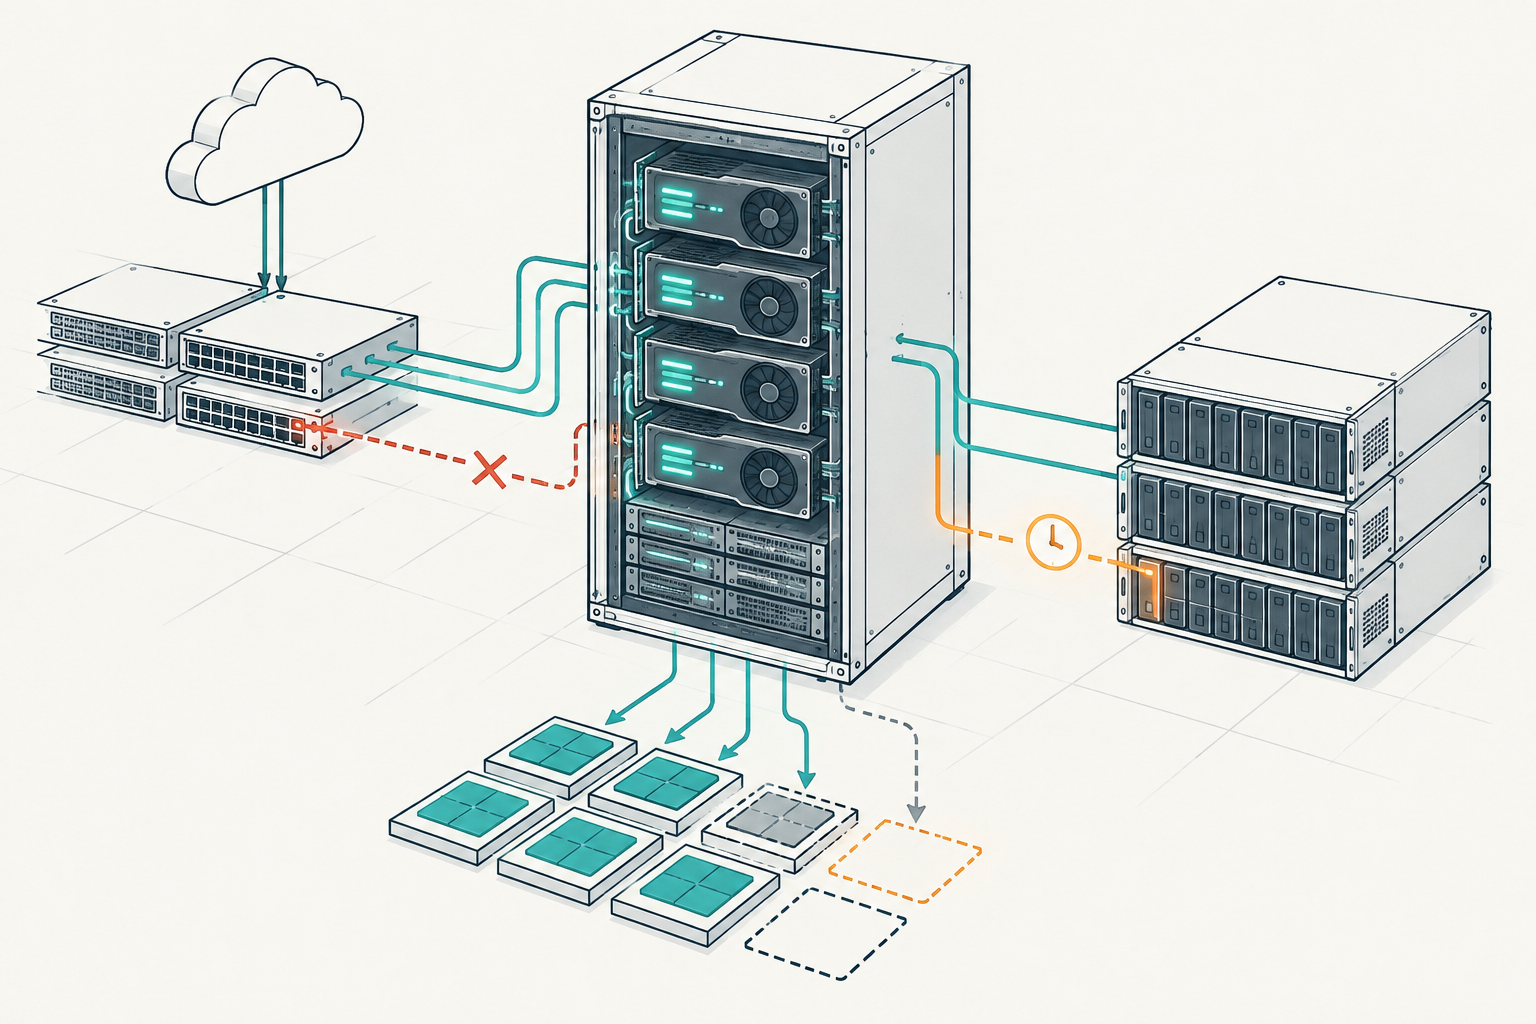
Minerva puts useful work ahead of busy hardware
NVIDIA’s October 26, 2026 Minerva technical publication describes correlating infrastructure telemetry with workloads to identify subtle failures. The operational change is where teams look for evidence: not just whether a GPU is active, but whether activity produces successful work at the expected rate. A device can remain allocated and report substantial activity while the application makes less progress than its operators expect.
The Minerva publication supplies the news peg. This investigation takes the described approach as its starting point, rather than treating it as a verified benchmark or a feature specification for another platform. The measurement plan below is an operational proposal, not a reproduction of Minerva’s implementation.
For enterprises running private infrastructure, the distinction matters financially. Owned GPUs consume capital, power and operating attention even when workloads stall. Scheduling more work onto them may improve allocation figures without improving delivery.
It also connects directly to rFactorial, the product group owned by Muscat-based Cognition-AI. Its Clastiq Orchestrator spans private-cloud compute, GPU, storage and networks: the domains operators must investigate together. That scope does not establish that Clastiq implements Minerva’s telemetry analytics or fault detection.
What a gray failure looks like
A gray failure is a partial or intermittent impairment that does not necessarily make a component appear unavailable. A network path still carries traffic, but retransmissions increase. Storage remains mounted, but reads develop long latency tails. A link stays up while delivering less bandwidth than its workload needs.
Distributed training makes these problems visible in awkward ways. Most workers may compute normally while one arrives late at a collective operation. The others wait, and total progress follows the slowest participant. Device activity alone cannot explain whether the system is delivering the expected training-step rate.
Inference has a different signature. A server may accept requests and keep accelerators occupied while storage delays model loading, contention disrupts batching, or overloaded dependencies stretch completion times. Throughput can look acceptable even as fewer responses meet the service objective.
Not every slowdown is a hardware failure. Changed input lengths, cache state, checkpoint frequency, model versions and sharing policies can produce similar symptoms. The investigation must first establish comparable work, then distinguish application changes from infrastructure impairment. A correlation is a lead, not a diagnosis.
Establish three separate accounting ledgers
Start with capacity. Record physical GPU-hours available during the reporting window, including devices reserved for maintenance or unavailable through failure. Keep those categories explicit rather than silently shrinking the denominator whenever capacity disappears.
Next record allocation. Track which workload held which resource, when its reservation began and ended, and what it requested. With GPU sharing, distinguish physical devices, partition profiles and logical sharing slots. Ten advertised slots on one GPU do not create ten physical GPU-hours each hour.
Finally record useful completion. For batch inference, this might mean unique records successfully processed and accepted. For training, use comparable progress such as validated steps or tokens processed under a fixed configuration, while separately tracking final quality. For serving, count successful requests meeting defined latency and correctness requirements.
| Ledger | Measure | What it cannot establish alone |
|---|---|---|
| Capacity | Physical GPU-hours available | Whether workloads used them |
| Allocation | Reserved device-hours or sharing-slot hours | Whether applications progressed |
| Completion | Accepted output meeting stated requirements | Why infrastructure slowed down |
| Efficiency | Accepted output per physical GPU-hour | Whether unlike workloads are comparable |
Keep retries, abandoned work and failed outputs visible. They consumed resources even when they produced nothing acceptable. Deduplicate completed outputs so retries cannot inflate the result.
Build a measurement contract before collecting everything
For each workload class, define a comparison unit and a completion rule. Record model or application version, input characteristics, precision, batch settings, worker count and placement policy. A throughput improvement obtained by shortening inputs is not infrastructure recovery.
Set two reporting windows. A short window, perhaps one minute, helps align stalls with infrastructure events. A longer window, such as a shift or day, captures retries, queueing and completed work. These are starting choices; tune them to job duration and telemetry cost.
Every job should have a stable identifier carried into application logs and the allocation record. Preserve mappings from that identifier to pods, nodes, GPU devices, relevant network interfaces and storage targets. Synchronize clocks and document timestamp resolution. Without those joins, operators end up comparing unrelated graphs by eye.
Assign ownership as part of the contract. Application owners define acceptable output; platform owners maintain placement records; network and storage owners explain their counters. Finance agrees how fixed infrastructure costs enter reporting. This prevents a later argument in which every team selects the denominator that makes its component look healthy.
Collect signals around the workload boundary
Begin with application progress: completion timestamps, training-step duration, accepted records, request latency, checkpoint duration and explicit wait states where available. Infrastructure signals become more useful when attached to an observed slowdown rather than collected without a question.
On GPUs, examine activity, memory use, power, clocks and available error indicators. On hosts, inspect CPU pressure, memory pressure and input-processing delays. For networking, inspect throughput, retransmissions, drops, congestion indicators and negotiated link state where exposed. For storage, include operation latency, throughput, queueing and read-versus-write patterns.
This Kubernetes command captures a small placement snapshot using standard tooling:
kubectl get pods -A -o wide > pod-placement.txt
kubectl get nodes -o wide > node-inventory.txt
kubectl describe node <node-name> > node-details.txt
These commands do not detect gray failures. They help establish where workloads ran and what Kubernetes reported at collection time. Historical attribution requires retaining placement changes and relevant events; a snapshot taken after rescheduling may miss the affected node entirely.
Restrict collection access and retention. Operational traces can reveal tenant names, dataset locations and business activity. Do not copy prompts, clinical content or customer records into infrastructure telemetry merely to make troubleshooting convenient.
Investigate with controlled comparisons
Choose one workload class with a stable baseline. Compare its progress rate across equivalent placements, then identify which infrastructure attributes differ. A slowdown shared by jobs on one storage target suggests a different investigation from a slowdown following one node across multiple datasets.
Use a timeline containing application progress, placement changes, network events and storage latency. Check whether suspected infrastructure degradation precedes the slowdown. A storage queue that grows after an application changes its write pattern may be an effect, not the original cause.
Then change one variable where feasible. Move a test workload to another node while holding its dataset and configuration constant. Alternatively, keep placement fixed and use a controlled storage path. Avoid shifting nodes, changing batch sizes and adjusting sharing policy simultaneously: a faster run would reveal little about causality.
Repeat the comparison and record negative results. Establish rollback conditions before testing production infrastructure. If the evidence implicates a shared link, coordinate with its owner rather than repeatedly restarting jobs and erasing the conditions needed to explain the problem.
An illustrative shift where allocation hides the loss
Consider an illustrative eight-GPU pool observed for ten hours. It supplies 80 physical GPU-hours. Workloads reserve GPUs for 72 device-hours, giving 90% allocation. Assume the fleet’s available activity telemetry also looks broadly similar before and after remediation. These figures are hypothetical, not NVIDIA or Clastiq benchmarks.
For a fixed batch-inference workload, previous controlled runs establish a reference rate of 100 accepted records per allocated GPU-hour. At that rate, 72 allocated hours would produce 7,200 accepted records. During the impaired shift, however, operators accept only 5,040 unique records after validation and deduplication.
The resulting rate is 70 accepted records per allocated GPU-hour, or 63 per available physical GPU-hour. Completion is 30% below the reference expectation despite 90% allocation. That gap is a reason to investigate, not proof that a network fault caused all of it.
Suppose controlled testing identifies a degraded network path affecting data delivery. After remediation, the same workload mix and allocation produce 6,840 accepted records: 95 per allocated GPU-hour and 85.5 per available GPU-hour. Accepted output rises by 1,800 records, or approximately 35.7%, without increasing allocated hours.
Assume an illustrative fully loaded pool cost of $320 for each ten-hour window. Cost per accepted record falls from approximately $0.0635 to $0.0468, a reduction of about 26.3%. The calculation includes the whole pool, including idle capacity. It does not claim the same reduction in electricity expense or immediate cash savings.
At the recovered rate, producing the original 5,040 records would require approximately 53.1 allocated GPU-hours instead of 72. The difference, about 18.9 hours, represents potential capacity released for other work. Converting that into business value still requires queued demand, compatible scheduling and sufficient supporting infrastructure.
Sharing policy can create similar symptoms
Kubernetes GPU sharing introduces another explanation for busy devices and disappointing completion. Before classifying a slowdown as a gray failure, ask whether the workload’s effective access changed because another tenant became active.
Time slicing lets multiple workloads take turns accessing a GPU under the configured stack. It is not, by itself, a hard GPU-memory partition or a guaranteed fraction of application throughput. Kubernetes namespace quotas can constrain requested resources without proving runtime isolation between sharing workloads.
MIG partitions supported GPUs into hardware instances with defined resources and stronger isolation boundaries. Its trade-offs include supported hardware, available profiles and capacity fragmentation. MPS supports concurrent CUDA processes and can improve concurrency for suitable workloads, but its resource controls and isolation properties should not be treated as interchangeable with MIG.
The operator’s question is therefore not simply “does Kubernetes support GPU sharing with hard limits?” Specify the limit: memory capacity, compute access, execution isolation or an application service objective. Then verify the device, software stack and enforcement mechanism. No configuration can guarantee end-to-end throughput while ignoring shared network and storage paths.
For deeper GPU planning and sharing guidance, use the Clastiq site rather than treating this investigation as a configuration manual. The linked local-inference rack test article is a related planning resource. Its workload assumptions should be checked before applying them elsewhere.
Connect orchestration to evidence, not assumed features
Clastiq Orchestrator’s documented role is private-cloud orchestration across compute, GPU, storage and networks. Clastiq Lite brings self-service AI and GPU sharing to teams. Those capabilities place rFactorial in the operational discussion, but they do not establish particular sharing implementations, telemetry integrations or automated remediation behavior.
A practical workflow separates measurement from action. First, application owners report a completion-rate regression. Operators join those records with infrastructure evidence using their available tools. Domain owners then test the suspected constraint. Only after that should an approved infrastructure or placement change enter the orchestration workflow.
Treat each proposed deployment as a requirements review. Ask how resource identities remain traceable, which configuration changes are recorded, how tenant boundaries are enforced, and which controls require external systems or operating procedures. Confirm implementation details rather than inferring them from the breadth of the product’s scope.
Governance also determines who may disrupt shared infrastructure. A team should not change GPU partitioning or storage placement to improve its own numbers without considering neighboring workloads. Record the approver, expected benefit, affected tenants, test window and rollback condition. Measure the resulting completion rate, not merely whether the change executed successfully.
Paying for idle on-premises GPUs
An owned GPU can be idle because there is no demand, because access is inconvenient, or because another resource prevents queued work from progressing. Those cases need different responses. Self-service may address access friction; it cannot manufacture demand or repair a constrained storage path by itself.
Separate unavoidable reserve capacity from stranded capacity. A reserve maintained for incidents or latency objectives has an explicit purpose. Capacity stranded behind incompatible partition sizes, unavailable datasets or placement restrictions needs an owner and a remediation hypothesis.
For global enterprises, compare sites using normalized workloads and consistent accounting. Regional electricity prices, staffing costs and data-location requirements can change the economics without changing device performance. Do not move sensitive workloads across jurisdictions solely because another site reports a better utilization percentage.
What to do this week
- Define one accepted-output measure for a representative workload, including latency or quality requirements and retry deduplication.
- Create separate capacity, allocation and completion reports. Label physical device-hours, partition-hours and sharing-slot hours distinctly.
- Retain workload-to-node placement history and align application, GPU, network and storage timestamps for one investigation window.
- Run a controlled comparison on the suspected constraint, with a named owner, approved test window and rollback condition.
- Audit one shared-GPU pool for its actual isolation guarantees, then calculate cost per accepted output before approving additional capacity.
Explore Clastiq Orchestrator for its documented private-cloud infrastructure scope and the rFactorial product family for the broader portfolio owned by Cognition-AI. Bring workload requirements and measurement evidence to the discussion; confirm specific implementation capabilities before making architectural commitments.